
Every link.
Optimized.
From the factory gate to the final doorstep. Connect location, inventory, warehouse and transport decisions in one workspace.
Explore the toolset ↗Location → Operations → Delivery
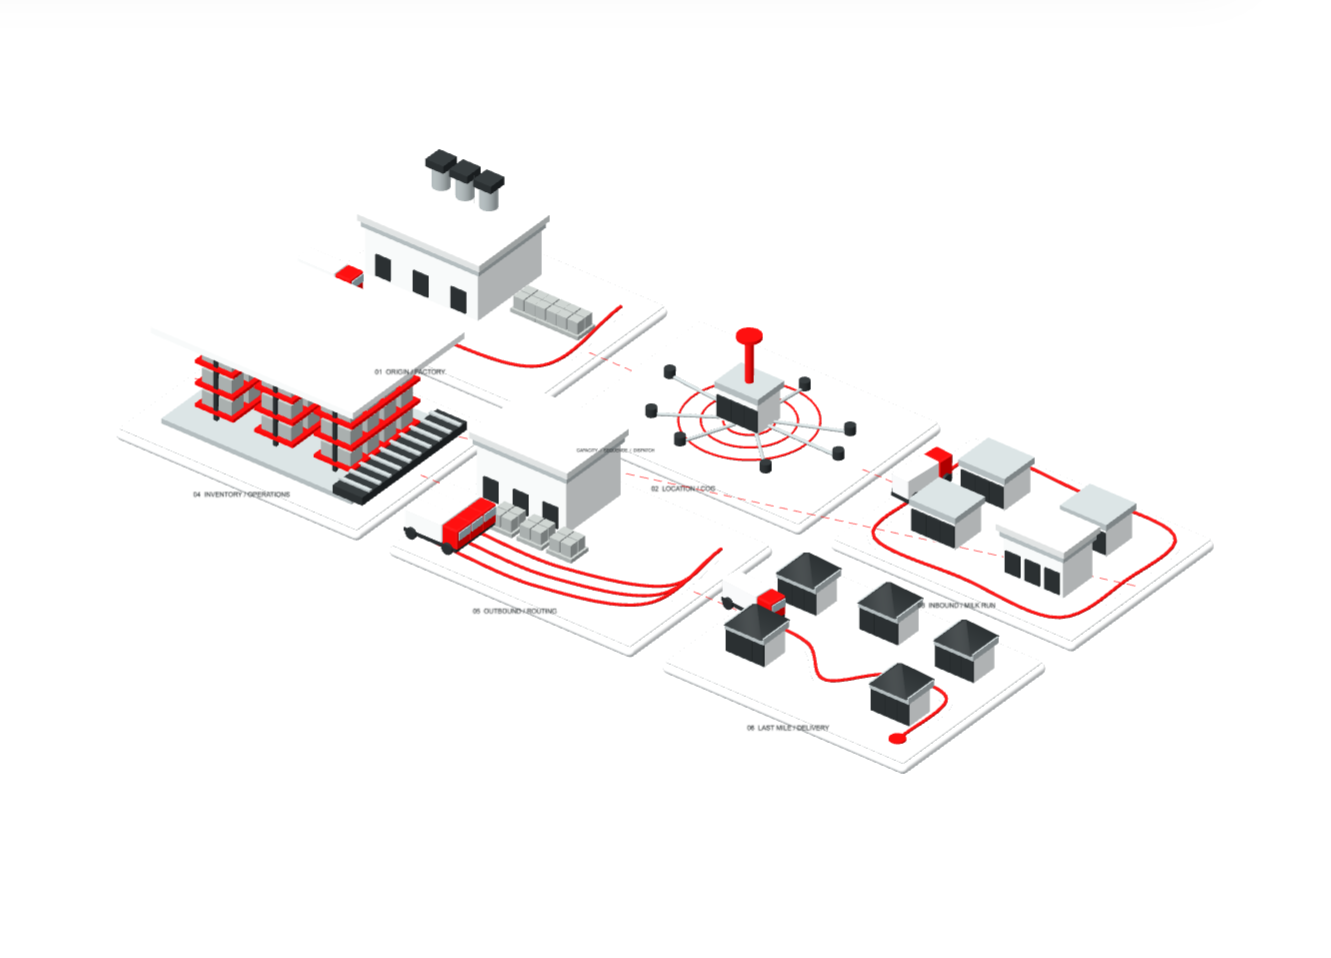
From the factory gate to the final doorstep. Connect location, inventory, warehouse and transport decisions in one workspace.
Explore the toolset ↗Location → Operations → Delivery

Illustrative network · geometry is schematic
A location changes the route. A forecast changes the stock. A loading decision changes the dispatch. Optimal brings the tools for these connected decisions into one place.
Centre-of-gravity network design: cluster demand, route on real roads, and place distribution centres.
02Turn an order list of process steps and shared resources into a feasible, makespan-minimizing schedule with a Gantt view.
03Paste any Task/Start/Finish/Resource schedule and view it as an interactive Gantt chart — no optimization, just visualization.
04Classify items into A/B/C bands by their cumulative share of total value — the classic 80/20 inventory segmentation.
05Classify articles by demand variability (coefficient of variation) — X for stable, steady demand, Z for erratic, hard-to-forecast demand.
06Grid-search reorder policies against a demand series, simulate every candidate, and pick the lowest-cost one that still clears your service-level target — with the full period-by-period trace.
07Fit trend and seasonality on one SKU's demand history and project it forward, with confidence bounds around each forecasted point.
08Fit an AutoARIMA model to a single sequential time series and project it forward — no trend/seasonality controls, the model order is searched automatically.
09Road distance, straight-line beeline, drive time, and routability for any two points — computed live via OSRM.
10Full origin-destination distance and duration matrix across a list of named locations — computed live via OSRM.
11Rank the N closest warehouses per customer within an optional radius — road distance or a fast beeline approximation, with unassigned customers flagged.
12Pick which candidate warehouses to open and which customers each should serve — a capacitated facility-location heuristic weighing fixed, variable, transport, and penalty costs.
13Location Planning plus the factory-to-warehouse inbound echelon — trucked lanes priced by a degressive distance rate and stepwise utilization discount.
14Network Design plus product-segment eligibility, wildcard transport-cost rules, stepwise warehouse cost functions, and network-level distance/service coverage limits.
15Reorder a route's intermediate stops to minimize total driven distance — first and last stops stay fixed. A nearest-neighbor + 2-opt heuristic, computed per Path Id.
16Cost-optimal depot-oriented pickup/delivery routing — decides which vehicles run, which orders they serve, in what sequence, and which orders are cheaper to outsource.
17Cost-optimal routing for independent pickup-and-delivery shipments — own fleet against outsourcing, vehicle assignment, and paired sequencing with precedence kept.
18The area reachable from an origin within a travel-time budget — Road mode hulls real drive-time samples via OSRM, Beeline mode draws a fast avg-speed x time circle.
19Which administrative areas are reachable from an origin within a travel-time budget — an avg-speed/detour-factor radius test against each area's center point, not a routing call.
20Assign customer locations to user-defined geographic areas by point-in-polygon matching, then roll up counts and quantities by area — territory coverage without manual GIS work.
21Pack packages into containers by transport relation, first-fit-decreasing across bins — floor-space utilization by relation, by container type, and per container, plus what didn't fit.
223D bin-packing across trucks/containers — weight, rotation, stackability, and relation-eligibility rules, compared across Guillotine and Layer strategies side by side.
23Turn a flow table into an interactive Sankey diagram — no solver, no assignments, just a fast way to see major routes, consolidation hubs, and bottlenecks in a network.
24Turn historical shipment costs into a defensible weight/distance rate matrix for tendering, with degression controls and a per-shipment deviation check.
25Model a warehouse as lines, racks and locations, then calculate travel distance, vertical movement and duration between every location and storage slot.
26Convert structured addresses or free-text search strings into standardized, confidence-scored coordinates — a batch job with row-level status and CSV export.
27Cost, transit-time, consolidation, and CO₂ analysis across your shipment legs — simulated freight cost against a benchmark tariff, plus optional consolidation into shared transports.
Bring your data. Choose your tool. Build your next supply chain decision.